Ouverture :
55.600 €
Perf Ouverture :
+1.73 %
+ Haut :
56.700 €
+ Bas :
55.600 €
Clôture veille :
55.860 €
Volume :
1 427 970
Capi échangé :
+0.08 %
Capi :
101 650 M€
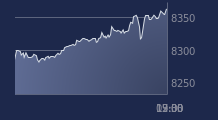
Graphique AB INBEV sur 5 jours
Cours AB INBEV sur 5 jours
| 06/01 | 07/01 | 08/01 | 09/01 | 09/01 | Date |
|---|---|---|---|---|---|
| 54.94 | 54.44 | 55.86 | 56.56 | 56.56 | Dernier |
| +1.78 % | -0.91 % | +2.61 % | +1.25 % | +1.25 % | Var. |
| 1370950 | 1668740 | 2684760 | 1427970 | 1427970 | Volume |
| 53.6 | 54.46 | 54.38 | 55.6 | 55.6 | Ouv. |
| 54.94 | 55.56 | 56.56 | 56.7 | 56.7 | + Haut |
| 53.3 | 54.14 | 54.16 | 55.6 | 55.6 | + Bas |
| 54.237 | 54.323 | 54.528 | 54.757 | 54.757 | MM20 |
| 53.9248 | 53.9584 | 54.0184 | 54.0868 | 54.0868 | MM50 |
| 52.8415 | 52.8607 | 52.8881 | 52.9195 | 52.9195 | MM100 |
Performances historiques AB INBEV
| 5 jours | 1 mois | 1er janvier | 5 ans |
|---|---|---|---|
| +3.97 % | +9.27 % | +3.02 % | -2.25 % |
Court terme
Haussière
Moyen terme
Haussière
Long terme
Haussière
Portefeuille Trading
+335.10 % vs +68.21 % pour le CAC 40
Performance depuis le 28 mai 2008


