


chiffres clés
Ouverture :
5.902 €
Perf Ouverture :
-0.20 %
+ Haut :
5.976 €
+ Bas :
5.706 €
Clôture veille :
5.872 €
Volume :
850 892
Capi échangé :
+0.62 %
Capi :
802 M€
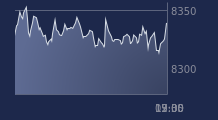
Graphique UBISOFT ENTERTAIN sur 5 jours
Cours UBISOFT ENTERTAIN sur 5 jours
| 06/07 | 07/07 | 08/07 | 09/07 | 10/07 | Date |
|---|---|---|---|---|---|
| 5.680(c) | 6.016(c) | 5.850(c) | 5.872(c) | 5.890(c) | Dernier |
| +2.90 % | +5.92 % | -2.76 % | +0.38 % | +0.31 % | Var. |
| 795 023 | 1 402 730 | 1 033 830 | 990 034 | 850 892 | Volume |
| 5.500 | 5.700 | 5.990 | 5.942 | 5.902 | Ouv. |
| 5.728 | 6.050 | 5.996 | 6.180 | 5.976 | + Haut |
| 5.370 | 5.600 | 5.640 | 5.802 | 5.706 | + Bas |
| 5.158 | 5.211 | 5.262 | 5.317 | 5.371 | MM20 |
| 5.138 | 5.159 | 5.178 | 5.197 | 5.216 | MM50 |
| 4.673 | 4.692 | 4.704 | 4.721 | 4.737 | MM100 |
Performances historiques UBISOFT ENTERTAIN
| 5 jours | 1 mois | 1er janvier | 5 ans |
|---|---|---|---|
| +6.70 % | +18.77 % | -8.57 % | -90.15 % |
Court terme
Haussière
Moyen terme
Haussière
Long terme
Haussière
Portefeuille Trading
+319.20 % vs +67.75 % pour le CAC 40
Performance depuis le 28 mai 2008