


chiffres clés
Ouverture :
225.900 €
Perf Ouverture :
-1.15 %
+ Haut :
226.400 €
+ Bas :
220.800 €
Clôture veille :
226.800 €
Volume :
189 791
Capi échangé :
+0.09 %
Capi :
45 987 M€
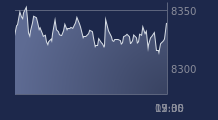
Graphique THALES sur 5 jours
Cours THALES sur 5 jours
| 06/07 | 07/07 | 08/07 | 09/07 | 10/07 | Date |
|---|---|---|---|---|---|
| 241.100(c) | 237.600(c) | 233.700(c) | 226.800(c) | 223.300(c) | Dernier |
| +1.22 % | -1.45 % | -1.64 % | -2.95 % | -1.54 % | Var. |
| 227 127 | 248 502 | 313 360 | 236 172 | 189 791 | Volume |
| 235.700 | 245.100 | 238.000 | 233.000 | 225.900 | Ouv. |
| 243.400 | 248.500 | 239.500 | 234.100 | 226.400 | + Haut |
| 233.200 | 237.100 | 231.700 | 225.300 | 220.800 | + Bas |
| 230.080 | 230.385 | 230.370 | 229.820 | 229.250 | MM20 |
| 230.046 | 230.174 | 230.226 | 230.160 | 229.948 | MM50 |
| 241.425 | 241.334 | 241.219 | 240.973 | 240.717 | MM100 |
Performances historiques THALES
| 5 jours | 1 mois | 1er janvier | 5 ans |
|---|---|---|---|
| -6.26 % | -3.54 % | -2.83 % | +148.61 % |
Court terme
Neutre
Moyen terme
Baissière
Long terme
Baissière
Portefeuille Trading
+319.20 % vs +67.75 % pour le CAC 40
Performance depuis le 28 mai 2008