Ouverture :
8.145 €
Perf Ouverture :
+1.47 %
+ Haut :
8.265 €
+ Bas :
8.135 €
Clôture veille :
8.145 €
Volume :
195 959
Capi échangé :
+0.09 %
Capi :
1 746 M€
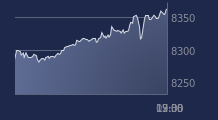
Graphique TF1 sur 5 jours
Cours TF1 sur 5 jours
| 06/01 | 07/01 | 08/01 | 09/01 | 09/01 | Date |
|---|---|---|---|---|---|
| 8.21 | 8.185 | 8.145 | 8.265 | 8.265 | Dernier |
| -0.18 % | -0.30 % | -0.49 % | +1.47 % | +1.47 % | Var. |
| 183441 | 191593 | 147790 | 195959 | 195959 | Volume |
| 8.25 | 8.24 | 8.185 | 8.145 | 8.145 | Ouv. |
| 8.29 | 8.24 | 8.185 | 8.265 | 8.265 | + Haut |
| 8.16 | 8.125 | 8.125 | 8.135 | 8.135 | + Bas |
| 8.15625 | 8.15375 | 8.153 | 8.16 | 8.16 | MM20 |
| 8.1301 | 8.127 | 8.1216 | 8.1193 | 8.1193 | MM50 |
| 8.3401 | 8.3363 | 8.33175 | 8.3288 | 8.3288 | MM100 |
Performances historiques TF1
| 5 jours | 1 mois | 1er janvier | 5 ans |
|---|---|---|---|
| -0.12 % | +1.29 % | -0.78 % | +16.57 % |
Court terme
Haussière
Moyen terme
Neutre
Long terme
Baissière
Portefeuille Trading
+335.10 % vs +68.21 % pour le CAC 40
Performance depuis le 28 mai 2008


