


chiffres clés
Ouverture :
54.000 €
Perf Ouverture :
-1.94 %
+ Haut :
54.100 €
+ Bas :
52.650 €
Clôture veille :
53.800 €
Volume :
301 421
Capi échangé :
+0.20 %
Capi :
7 808 M€
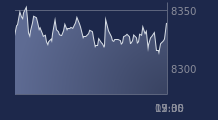
Graphique SODEXO sur 5 jours
Cours SODEXO sur 5 jours
| 07/07 | 08/07 | 09/07 | 10/07 | 13/07 | Date |
|---|---|---|---|---|---|
| 53.400(c) | 54.100(c) | 53.800(c) | 52.950(c) | - | Dernier |
| +1.81 % | +1.31 % | -0.55 % | -1.58 % | - | Var. |
| 235 046 | 302 970 | 261 027 | 301 421 | - | Volume |
| 52.750 | 53.600 | 53.950 | 54.000 | - | Ouv. |
| 53.600 | 54.200 | 54.250 | 54.100 | - | + Haut |
| 52.650 | 53.350 | 53.450 | 52.650 | - | + Bas |
| 50.963 | 51.211 | 51.469 | 51.597 | - | MM20 |
| 47.958 | 48.193 | 48.414 | 48.607 | - | MM50 |
| 46.049 | 46.119 | 46.189 | 46.247 | - | MM100 |
Performances historiques SODEXO
| 5 jours | 1 mois | 1er janvier | 5 ans |
|---|---|---|---|
| +0.19 % | +8.28 % | +21.17 % | -7.43 % |
Court terme
Haussière
Moyen terme
Haussière
Long terme
Haussière
Portefeuille Trading
+319.20 % vs +67.75 % pour le CAC 40
Performance depuis le 28 mai 2008