


chiffres clés
Ouverture :
136.100 €
Perf Ouverture :
-2.28 %
+ Haut :
136.400 €
+ Bas :
130.900 €
Clôture veille :
136.000 €
Volume :
106 121
Capi échangé :
+0.24 %
Capi :
5 818 M€
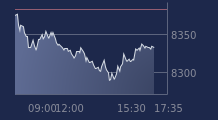
Graphique NEXANS sur 5 jours
Cours NEXANS sur 5 jours
| 10/07 | 13/07 | 14/07 | 15/07 | 16/07 | Date |
|---|---|---|---|---|---|
| 134.000(c) | 133.800(c) | 135.800(c) | 136.000(c) | 132.900 | Dernier |
| +0.90 % | -0.15 % | +1.49 % | +0.15 % | -2.28 % | Var. |
| 145 970 | 111 023 | 122 132 | 183 299 | 106 216 | Volume |
| 132.400 | 132.600 | 133.100 | 135.600 | 136.100 | Ouv. |
| 134.200 | 133.800 | 138.700 | 137.200 | 136.400 | + Haut |
| 132.400 | 131.100 | 132.500 | 134.200 | 130.900 | + Bas |
| 144.600 | 143.875 | 143.195 | 142.340 | 141.265 | MM20 |
| 153.074 | 152.590 | 152.130 | 151.522 | 150.956 | MM50 |
| 139.417 | 139.390 | 139.482 | 139.581 | 139.681 | MM100 |
Performances historiques NEXANS
| 5 jours | 1 mois | 1er janvier | 5 ans |
|---|---|---|---|
| +0.15 % | -10.32 % | +5.72 % | +64.71 % |
Court terme
Baissière
Moyen terme
Baissière
Long terme
Neutre
Portefeuille Trading
+319.50 % vs +67.78 % pour le CAC 40
Performance depuis le 28 mai 2008