


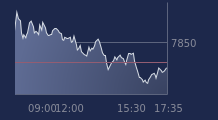
chiffres clés
Ouverture :
8.160 €
Perf Ouverture :
+1.35 %
+ Haut :
8.270 €
+ Bas :
8.130 €
Clôture veille :
8.170 €
Volume :
107 295
Capi échangé :
+0.05 %
Capi :
1 664 M€
Graphique MAUREL ET PROM sur 5 jours
Cours MAUREL ET PROM sur 5 jours
| 07/10 | 08/10 | 09/10 | 12/10 | 13/10 | Date |
|---|---|---|---|---|---|
| 7.805(c) | 8.135(c) | 8.180(c) | 8.170(c) | 8.270(c) | Dernier |
| +1.69 % | +4.23 % | +0.55 % | -0.12 % | +1.22 % | Var. |
| 184 707 | 195 672 | 131 399 | 143 651 | 107 295 | Volume |
| 7.805 | 7.890 | 8.055 | 8.160 | 8.160 | Ouv. |
| 8.000 | 8.140 | 8.200 | 8.215 | 8.270 | + Haut |
| 7.775 | 7.865 | 8.020 | 8.060 | 8.130 | + Bas |
| 8.064 | 8.057 | 8.059 | 8.047 | 8.036 | MM20 |
| 8.086 | 8.086 | 8.087 | 8.089 | 8.096 | MM50 |
| 8.265 | 8.246 | 8.229 | 8.215 | 8.200 | MM100 |
Performances historiques MAUREL ET PROM
| 5 jours | 1 mois | 1er janvier | 5 ans |
|---|---|---|---|
| +7.75 % | +1.60 % | +49.68 % | +233.47 % |
Court terme
Neutre
Moyen terme
Neutre
Long terme
Neutre
Portefeuille Trading
+315.90 % vs +57.46 % pour le CAC 40
Performance depuis le 28 mai 2008