


chiffres clés
Ouverture :
7.890 €
Perf Ouverture :
-1.33 %
+ Haut :
7.920 €
+ Bas :
7.770 €
Clôture veille :
7.915 €
Volume :
107 645
Capi échangé :
+0.05 %
Capi :
1 567 M€
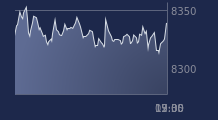
Graphique MAUREL ET PROM sur 5 jours
Cours MAUREL ET PROM sur 5 jours
| 06/07 | 07/07 | 08/07 | 09/07 | 10/07 | Date |
|---|---|---|---|---|---|
| 7.680(c) | 7.620(c) | 8.100(c) | 7.915(c) | 7.785(c) | Dernier |
| -0.52 % | -0.78 % | +6.30 % | -2.28 % | -1.64 % | Var. |
| 85 632 | 130 360 | 458 079 | 228 309 | 107 645 | Volume |
| 7.665 | 7.615 | 7.910 | 8.000 | 7.890 | Ouv. |
| 7.735 | 7.690 | 8.150 | 8.050 | 7.920 | + Haut |
| 7.605 | 7.535 | 7.765 | 7.860 | 7.770 | + Bas |
| 8.169 | 8.098 | 8.041 | 7.972 | 7.910 | MM20 |
| 9.062 | 9.025 | 8.995 | 8.958 | 8.915 | MM50 |
| 9.337 | 9.338 | 9.342 | 9.345 | 9.347 | MM100 |
Performances historiques MAUREL ET PROM
| 5 jours | 1 mois | 1er janvier | 5 ans |
|---|---|---|---|
| +0.84 % | -13.88 % | +40.90 % | +325.88 % |
Court terme
Neutre
Moyen terme
Baissière
Long terme
Neutre
Portefeuille Trading
+319.20 % vs +67.75 % pour le CAC 40
Performance depuis le 28 mai 2008