


chiffres clés
Ouverture :
8.910 €
Perf Ouverture :
+0.34 %
+ Haut :
9.090 €
+ Bas :
8.900 €
Clôture veille :
8.830 €
Volume :
13 727
Capi échangé :
+0.11 %
Capi :
113 M€
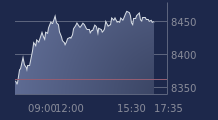
Graphique GUERBET sur 5 jours
Cours GUERBET sur 5 jours
| 16/07 | 17/07 | 20/07 | 21/07 | 22/07 | Date |
|---|---|---|---|---|---|
| 8.860(c) | 8.960(c) | 8.760(c) | 8.830(c) | 8.940 | Dernier |
| +0.68 % | +1.13 % | -2.23 % | +0.80 % | +1.25 % | Var. |
| 7 280 | 15 435 | 15 066 | 11 686 | 13 727 | Volume |
| 8.790 | 8.860 | 9.170 | 8.820 | 8.910 | Ouv. |
| 8.910 | 9.280 | 9.180 | 8.870 | 9.090 | + Haut |
| 8.740 | 8.750 | 8.750 | 8.700 | 8.900 | + Bas |
| 8.958 | 8.945 | 8.928 | 8.908 | 8.896 | MM20 |
| 9.640 | 9.608 | 9.577 | 9.554 | 9.532 | MM50 |
| 10.094 | 10.050 | 10.004 | 9.959 | 9.915 | MM100 |
Performances historiques GUERBET
| 5 jours | 1 mois | 1er janvier | 5 ans |
|---|---|---|---|
| +1.59 % | -3.04 % | -37.48 % | -68.52 % |
Court terme
Neutre
Moyen terme
Baissière
Long terme
Baissière
Portefeuille Trading
+318.60 % vs +70.07 % pour le CAC 40
Performance depuis le 28 mai 2008