


chiffres clés
Ouverture :
88.000 €
Perf Ouverture :
-0.77 %
+ Haut :
88.050 €
+ Bas :
87.130 €
Clôture veille :
89.550 €
Volume :
396 999
Capi échangé :
+0.04 %
Capi :
95 703 M€
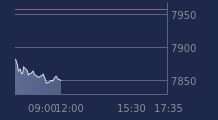
Graphique BNP PARIBAS ACT.A sur 5 jours
Cours BNP PARIBAS ACT.A sur 5 jours
| 13/10 | 14/10 | 15/10 | 16/10 | 19/10 | Date |
|---|---|---|---|---|---|
| 90.230(c) | 89.590(c) | 88.940(c) | 89.550(c) | 87.350 | Dernier |
| +0.16 % | -0.71 % | -0.73 % | +0.69 % | -2.46 % | Var. |
| 2 005 170 | 2 394 540 | 2 803 890 | 2 539 320 | 395 184 | Volume |
| 90.990 | 89.920 | 89.000 | 89.970 | 88.000 | Ouv. |
| 91.300 | 90.510 | 90.410 | 90.110 | 88.050 | + Haut |
| 89.850 | 89.070 | 88.130 | 89.310 | 87.130 | + Bas |
| 96.008 | 95.371 | 94.629 | 94.070 | 93.382 | MM20 |
| 102.363 | 101.912 | 101.439 | 100.981 | 100.472 | MM50 |
| 101.548 | 101.521 | 101.493 | 101.459 | 101.407 | MM100 |
Performances historiques BNP PARIBAS ACT.A
| 5 jours | 1 mois | 1er janvier | 5 ans |
|---|---|---|---|
| -3.07 % | -13.32 % | +8.08 % | +50.53 % |
Court terme
Baissière
Moyen terme
Baissière
Long terme
Baissière
Portefeuille Trading
+315.30 % vs +57.94 % pour le CAC 40
Performance depuis le 28 mai 2008