


chiffres clés
Ouverture :
23.630 €
Perf Ouverture :
-0.25 %
+ Haut :
24.330 €
+ Bas :
23.570 €
Clôture veille :
23.550 €
Volume :
736 767
Capi échangé :
+0.31 %
Capi :
5 585 M€
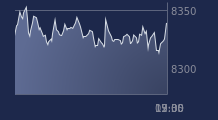
Graphique EDENRED sur 5 jours
Cours EDENRED sur 5 jours
| 06/07 | 07/07 | 08/07 | 09/07 | 10/07 | Date |
|---|---|---|---|---|---|
| 23.320(c) | 23.600(c) | 23.090(c) | 23.550(c) | 23.570(c) | Dernier |
| -2.47 % | +1.20 % | -2.16 % | +1.99 % | +0.08 % | Var. |
| 861 025 | 823 974 | 609 445 | 662 030 | 736 767 | Volume |
| 23.680 | 23.480 | 23.460 | 23.040 | 23.630 | Ouv. |
| 24.110 | 23.610 | 23.560 | 23.550 | 24.330 | + Haut |
| 23.320 | 23.190 | 23.040 | 23.040 | 23.570 | + Bas |
| 22.140 | 22.225 | 22.371 | 22.535 | 22.675 | MM20 |
| 22.014 | 22.057 | 22.085 | 22.127 | 22.173 | MM50 |
| 20.280 | 20.333 | 20.383 | 20.442 | 20.498 | MM100 |
Performances historiques EDENRED
| 5 jours | 1 mois | 1er janvier | 5 ans |
|---|---|---|---|
| -1.42 % | +7.63 % | +24.64 % | -51.51 % |
Court terme
Haussière
Moyen terme
Haussière
Long terme
Haussière
Portefeuille Trading
+319.20 % vs +67.75 % pour le CAC 40
Performance depuis le 28 mai 2008