


chiffres clés
Ouverture :
44.390 €
Perf Ouverture :
-0.27 %
+ Haut :
44.500 €
+ Bas :
44.140 €
Clôture veille :
44.300 €
Volume :
1 925 600
Capi échangé :
+0.09 %
Capi :
92 561 M€
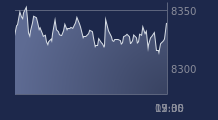
Graphique AXA sur 5 jours
Cours AXA sur 5 jours
| 06/07 | 07/07 | 08/07 | 09/07 | 10/07 | Date |
|---|---|---|---|---|---|
| 44.170(c) | 44.300(c) | 44.010(c) | 44.300(c) | 44.270(c) | Dernier |
| +1.05 % | +0.29 % | -0.65 % | +0.66 % | -0.07 % | Var. |
| 1 865 120 | 3 563 210 | 3 153 840 | 1 935 900 | 1 925 600 | Volume |
| 43.990 | 44.260 | 43.930 | 44.130 | 44.390 | Ouv. |
| 44.230 | 44.540 | 44.220 | 44.310 | 44.500 | + Haut |
| 43.880 | 44.040 | 43.290 | 44.010 | 44.140 | + Bas |
| 42.549 | 42.755 | 42.929 | 43.121 | 43.291 | MM20 |
| 41.075 | 41.146 | 41.207 | 41.288 | 41.355 | MM50 |
| 40.342 | 40.406 | 40.471 | 40.537 | 40.592 | MM100 |
Performances historiques AXA
| 5 jours | 1 mois | 1er janvier | 5 ans |
|---|---|---|---|
| +1.28 % | +10.21 % | +8.08 % | +102.93 % |
Court terme
Haussière
Moyen terme
Haussière
Long terme
Haussière
Portefeuille Trading
+319.20 % vs +67.75 % pour le CAC 40
Performance depuis le 28 mai 2008