


chiffres clés
Ouverture :
0.732 €
Perf Ouverture :
+0.14 %
+ Haut :
0.743 €
+ Bas :
0.730 €
Clôture veille :
0.750 €
Volume :
144 000
Capi échangé :
+0.20 %
Capi :
54 M€
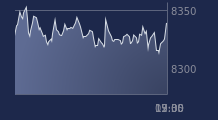
Graphique AB SCIENCE sur 5 jours
Cours AB SCIENCE sur 5 jours
| 06/07 | 07/07 | 08/07 | 09/07 | 10/07 | Date |
|---|---|---|---|---|---|
| 0.760(c) | 0.755(c) | 0.740(c) | 0.750(c) | 0.733(c) | Dernier |
| -1.68 % | -0.66 % | -1.99 % | +1.35 % | -2.27 % | Var. |
| 216 989 | 171 340 | 270 840 | 245 638 | 144 000 | Volume |
| 0.760 | 0.760 | 0.773 | 0.737 | 0.732 | Ouv. |
| 0.769 | 0.767 | 0.775 | 0.753 | 0.743 | + Haut |
| 0.753 | 0.740 | 0.725 | 0.728 | 0.730 | + Bas |
| 0.858 | 0.851 | 0.843 | 0.836 | 0.828 | MM20 |
| 0.933 | 0.925 | 0.916 | 0.909 | 0.903 | MM50 |
| 1.085 | 1.079 | 1.073 | 1.068 | 1.063 | MM100 |
Performances historiques AB SCIENCE
| 5 jours | 1 mois | 1er janvier | 5 ans |
|---|---|---|---|
| -5.17 % | -18.01 % | -52.28 % | -91.32 % |
Court terme
Baissière
Moyen terme
Baissière
Long terme
Baissière
Pas de conseil sur cette valeur
Portefeuille Trading
+319.20 % vs +67.75 % pour le CAC 40
Performance depuis le 28 mai 2008