


chiffres clés
Ouverture :
2.500 €
Perf Ouverture :
+4.00 %
+ Haut :
2.600 €
+ Bas :
2.490 €
Clôture veille :
2.750 €
Volume :
21 638
Capi échangé :
+0.33 %
Capi :
17 M€
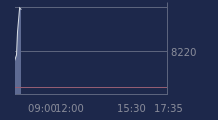
Graphique ARTMARKET COM sur 5 jours
Cours ARTMARKET COM sur 5 jours
| 04/06 | 05/06 | 08/06 | 09/06 | 10/06 | Date |
|---|---|---|---|---|---|
| 2.730(c) | 2.720(c) | 2.750(c) | 2.750(c) | 2.600 | Dernier |
| -2.15 % | -0.37 % | +1.10 % | 0.00 % | -5.45 % | Var. |
| 1 335 | 4 598 | 173 | 3 540 | 21 638 | Volume |
| 2.780 | 2.680 | 2.750 | 2.730 | 2.500 | Ouv. |
| 2.780 | 2.750 | 2.750 | 2.770 | 2.600 | + Haut |
| 2.680 | 2.650 | 2.740 | 2.640 | 2.490 | + Bas |
| 2.867 | 2.853 | 2.840 | 2.828 | 2.808 | MM20 |
| 2.872 | 2.869 | 2.867 | 2.866 | 2.862 | MM50 |
| 3.000 | 2.993 | 2.986 | 2.979 | 2.971 | MM100 |
Performances historiques ARTMARKET COM
| 5 jours | 1 mois | 1er janvier | 5 ans |
|---|---|---|---|
| -6.81 % | -13.33 % | -26.55 % | -56.45 % |
Court terme
Baissière
Moyen terme
Baissière
Long terme
Baissière
Pas de conseil sur cette valeur
Portefeuille Trading
+324.00 % vs +65.62 % pour le CAC 40
Performance depuis le 28 mai 2008