


chiffres clés
Ouverture :
3.270 €
Perf Ouverture :
+1.83 %
+ Haut :
3.380 €
+ Bas :
3.170 €
Clôture veille :
3.290 €
Volume :
3 677
Capi échangé :
+0.06 %
Capi :
20 M€
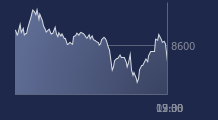
Graphique XILAM ANIMATION sur 5 jours
Cours XILAM ANIMATION sur 5 jours
| 23/02 | 24/02 | 25/02 | 26/02 | 27/02 | Date |
|---|---|---|---|---|---|
| 3.360(c) | 3.300(c) | 3.280(c) | 3.290(c) | 3.330(c) | Dernier |
| 0.00 % | -1.79 % | -0.61 % | +0.30 % | +1.22 % | Var. |
| 45 397 | 2 978 | 7 134 | 1 722 | 3 677 | Volume |
| 3.300 | 3.340 | 3.300 | 3.280 | 3.270 | Ouv. |
| 3.360 | 3.360 | 3.300 | 3.290 | 3.380 | + Haut |
| 3.300 | 3.300 | 3.150 | 3.160 | 3.170 | + Bas |
| 3.752 | 3.731 | 3.709 | 3.686 | 3.666 | MM20 |
| 3.754 | 3.743 | 3.731 | 3.718 | 3.707 | MM50 |
| 3.854 | 3.851 | 3.850 | 3.848 | 3.848 | MM100 |
Performances historiques XILAM ANIMATION
| 5 jours | 1 mois | 1er janvier | 5 ans |
|---|---|---|---|
| -0.89 % | -11.20 % | -11.67 % | -92.62 % |
Court terme
Baissière
Moyen terme
Baissière
Long terme
Baissière
Portefeuille Trading
+334.30 % vs +72.61 % pour le CAC 40
Performance depuis le 28 mai 2008