Ouverture :
1.520 €
Perf Ouverture :
+0.99 %
+ Haut :
1.546 €
+ Bas :
1.483 €
Clôture veille :
1.496 €
Volume :
2 000 680
Capi échangé :
+0.71 %
Capi :
435 M€
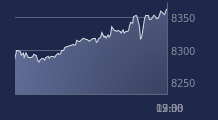
Graphique WORLDLINE sur 5 jours
Cours WORLDLINE sur 5 jours
| 06/01 | 07/01 | 08/01 | 09/01 | 09/01 | Date |
|---|---|---|---|---|---|
| 1.547 | 1.486 | 1.4955 | 1.535 | 1.535 | Dernier |
| -3.79 % | -3.94 % | +0.64 % | +2.64 % | +2.64 % | Var. |
| 1469930 | 3012980 | 2007400 | 2000680 | 2000680 | Volume |
| 1.618 | 1.563 | 1.491 | 1.52 | 1.52 | Ouv. |
| 1.621 | 1.568 | 1.5205 | 1.5455 | 1.5455 | + Haut |
| 1.5415 | 1.4805 | 1.486 | 1.4825 | 1.4825 | + Bas |
| 1.5135 | 1.52038 | 1.5295 | 1.5393 | 1.5393 | MM20 |
| 1.73093 | 1.70969 | 1.68854 | 1.67096 | 1.67096 | MM50 |
| 2.23312 | 2.21834 | 2.20389 | 2.18902 | 2.18902 | MM100 |
Performances historiques WORLDLINE
| 5 jours | 1 mois | 1er janvier | 5 ans |
|---|---|---|---|
| -5.91 % | +16.91 % | -1.73 % | -98.03 % |
Court terme
Neutre
Moyen terme
Neutre
Long terme
Baissière
Pas de conseil sur cette valeur
Portefeuille Trading
+335.10 % vs +68.21 % pour le CAC 40
Performance depuis le 28 mai 2008


