


chiffres clés
Ouverture :
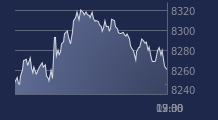
82.000 €
Perf Ouverture :
+0.79 %
+ Haut :
83.850 €
+ Bas :
82.000 €
Clôture veille :
81.900 €
Volume :
60 972
Capi échangé :
+0.14 %
Capi :
3 539 M€
Graphique WENDEL sur 5 jours
Cours WENDEL sur 5 jours
| 02/04 | 07/04 | 08/04 | 09/04 | 10/04 | Date |
|---|---|---|---|---|---|
| 79.700(c) | 79.500(c) | 82.500(c) | 81.900(c) | 82.650(c) | Dernier |
| +0.69 % | -0.25 % | +3.77 % | -0.73 % | +0.92 % | Var. |
| 82 657 | 68 145 | 79 123 | 99 339 | 60 972 | Volume |
| 78.150 | 80.050 | 82.100 | 82.000 | 82.000 | Ouv. |
| 79.800 | 81.200 | 83.700 | 82.550 | 83.850 | + Haut |
| 78.000 | 79.000 | 81.850 | 81.200 | 82.000 | + Bas |
| 77.463 | 77.258 | 77.328 | 77.323 | 77.430 | MM20 |
| 82.905 | 82.858 | 82.881 | 82.890 | 82.915 | MM50 |
| 81.350 | 81.351 | 81.381 | 81.415 | 81.460 | MM100 |
Performances historiques WENDEL
| 5 jours | 1 mois | 1er janvier | 5 ans |
|---|---|---|---|
| +3.70 % | +1.91 % | +0.55 % | -24.73 % |
Court terme
Haussière
Moyen terme
Haussière
Long terme
Haussière
Portefeuille Trading
+332.70 % vs +66.15 % pour le CAC 40
Performance depuis le 28 mai 2008