


chiffres clés
Ouverture :
0.774 €
Perf Ouverture :
-2.20 %
+ Haut :
0.774 €
+ Bas :
0.740 €
Clôture veille :
0.744 €
Volume :
50 461
Capi échangé :
+0.02 %
Capi :
211 M€
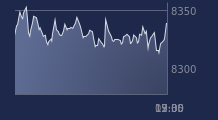
Graphique TRANSGENE sur 5 jours
Cours TRANSGENE sur 5 jours
| 06/07 | 07/07 | 08/07 | 09/07 | 10/07 | Date |
|---|---|---|---|---|---|
| 0.775(c) | 0.772(c) | 0.750(c) | 0.744(c) | 0.757(c) | Dernier |
| +2.65 % | -0.39 % | -2.85 % | -0.80 % | +1.75 % | Var. |
| 70 898 | 15 130 | 29 800 | 17 177 | 50 461 | Volume |
| 0.757 | 0.775 | 0.773 | 0.750 | 0.774 | Ouv. |
| 0.783 | 0.775 | 0.774 | 0.755 | 0.774 | + Haut |
| 0.750 | 0.766 | 0.750 | 0.744 | 0.740 | + Bas |
| 0.749 | 0.749 | 0.748 | 0.747 | 0.746 | MM20 |
| 0.780 | 0.781 | 0.781 | 0.781 | 0.781 | MM50 |
| 0.786 | 0.785 | 0.784 | 0.783 | 0.782 | MM100 |
Performances historiques TRANSGENE
| 5 jours | 1 mois | 1er janvier | 5 ans |
|---|---|---|---|
| +0.26 % | -2.32 % | -21.15 % | -66.65 % |
Court terme
Neutre
Moyen terme
Neutre
Long terme
Neutre
Pas de conseil sur cette valeur
Portefeuille Trading
+319.20 % vs +67.75 % pour le CAC 40
Performance depuis le 28 mai 2008