


chiffres clés
Ouverture :
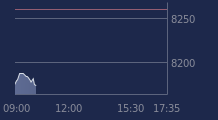
17.200 €
Perf Ouverture :
-0.70 %
+ Haut :
17.200 €
+ Bas :
16.760 €
Clôture veille :
17.400 €
Volume :
7 404
Capi échangé :
+0.00 %
Capi :
3 015 M€
Graphique TIKEHAU CAPITAL sur 5 jours
Cours TIKEHAU CAPITAL sur 5 jours
| 07/04 | 08/04 | 09/04 | 10/04 | 13/04 | Date |
|---|---|---|---|---|---|
| 16.600(c) | 16.840(c) | 17.160(c) | 17.400(c) | 17.080 | Dernier |
| +0.48 % | +1.45 % | +1.90 % | +1.40 % | -1.84 % | Var. |
| 29 442 | 51 496 | 56 044 | 29 378 | 7 404 | Volume |
| 16.520 | 17.000 | 17.000 | 17.100 | 17.200 | Ouv. |
| 16.860 | 17.440 | 17.180 | 17.600 | 17.200 | + Haut |
| 16.440 | 16.740 | 16.620 | 17.040 | 16.760 | + Bas |
| 15.823 | 15.835 | 15.881 | 15.956 | 16.027 | MM20 |
| 16.352 | 16.365 | 16.387 | 16.416 | 16.439 | MM50 |
| 15.974 | 15.990 | 16.011 | 16.035 | 16.054 | MM100 |
Performances historiques TIKEHAU CAPITAL
| 5 jours | 1 mois | 1er janvier | 5 ans |
|---|---|---|---|
| +3.39 % | +9.07 % | +7.83 % | -32.62 % |
Court terme
Haussière
Moyen terme
Haussière
Long terme
Haussière
Portefeuille Trading
+332.70 % vs +64.34 % pour le CAC 40
Performance depuis le 28 mai 2008