


chiffres clés
Ouverture :
55.660 €
Perf Ouverture :
+14.52 %
+ Haut :
65.160 €
+ Bas :
55.660 €
Clôture veille :
53.560 €
Volume :
914 871
Capi échangé :
+2.56 %
Capi :
2 280 M€
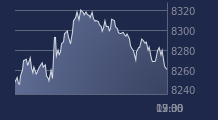
Graphique SOITEC sur 5 jours
Cours SOITEC sur 5 jours
| 07/04 | 08/04 | 09/04 | 10/04 | 13/04 | Date |
|---|---|---|---|---|---|
| 49.000(c) | 54.220(c) | 53.560(c) | 63.740(c) | - | Dernier |
| -2.00 % | +10.65 % | -1.22 % | +19.01 % | - | Var. |
| 336 714 | 581 665 | 189 682 | 914 871 | - | Volume |
| 49.570 | 53.620 | 53.860 | 55.660 | - | Ouv. |
| 51.540 | 55.640 | 54.220 | 65.160 | - | + Haut |
| 48.550 | 52.000 | 51.940 | 55.660 | - | + Bas |
| 53.359 | 53.982 | 54.451 | 55.073 | - | MM20 |
| 42.507 | 43.036 | 43.546 | 44.271 | - | MM50 |
| 34.785 | 34.931 | 35.086 | 35.348 | - | MM100 |
Performances historiques SOITEC
| 5 jours | 1 mois | 1er janvier | 5 ans |
|---|---|---|---|
| +27.48 % | +52.60 % | +174.86 % | -64.39 % |
Court terme
Haussière
Moyen terme
Haussière
Long terme
Haussière
Portefeuille Trading
+332.70 % vs +66.15 % pour le CAC 40
Performance depuis le 28 mai 2008