


chiffres clés
Ouverture :
0.800 €
Perf Ouverture :
-1.00 %
+ Haut :
0.800 €
+ Bas :
0.792 €
Clôture veille :
0.794 €
Volume :
4 749
Capi échangé :
+0.00 %
Capi :
94 M€
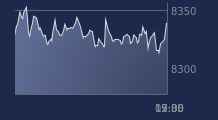
Graphique SHOWROOMPRIVE.COM sur 5 jours
Cours SHOWROOMPRIVE.COM sur 5 jours
| 06/07 | 07/07 | 08/07 | 09/07 | 10/07 | Date |
|---|---|---|---|---|---|
| 0.788(c) | 0.788(c) | 0.796(c) | 0.794(c) | 0.792(c) | Dernier |
| +2.87 % | 0.00 % | +1.02 % | -0.25 % | -0.25 % | Var. |
| 21 087 | 3 085 | 38 144 | 3 015 | 4 749 | Volume |
| 0.780 | 0.788 | 0.790 | 0.798 | 0.800 | Ouv. |
| 0.790 | 0.790 | 0.800 | 0.800 | 0.800 | + Haut |
| 0.766 | 0.776 | 0.782 | 0.794 | 0.792 | + Bas |
| 0.789 | 0.786 | 0.783 | 0.782 | 0.781 | MM20 |
| 0.785 | 0.787 | 0.790 | 0.793 | 0.796 | MM50 |
| 0.729 | 0.730 | 0.730 | 0.731 | 0.731 | MM100 |
Performances historiques SHOWROOMPRIVE.COM
| 5 jours | 1 mois | 1er janvier | 5 ans |
|---|---|---|---|
| +3.39 % | -6.82 % | +48.31 % | -75.56 % |
Court terme
Neutre
Moyen terme
Neutre
Long terme
Haussière
Pas de conseil sur cette valeur
Portefeuille Trading
+319.20 % vs +67.75 % pour le CAC 40
Performance depuis le 28 mai 2008