


chiffres clés
Ouverture :
36.000 €
Perf Ouverture :
-0.83 %
+ Haut :
36.120 €
+ Bas :
35.620 €
Clôture veille :
36.000 €
Volume :
356 842
Capi échangé :
+0.35 %
Capi :
3 692 M€
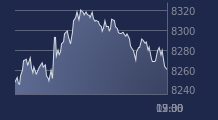
Graphique RUBIS sur 5 jours
Cours RUBIS sur 5 jours
| 02/04 | 07/04 | 08/04 | 09/04 | 10/04 | Date |
|---|---|---|---|---|---|
| 35.060(c) | 35.160(c) | 35.620(c) | 36.000(c) | 35.700(c) | Dernier |
| +0.57 % | +0.29 % | +1.31 % | +1.07 % | -0.83 % | Var. |
| 113 528 | 184 543 | 176 724 | 104 547 | 356 842 | Volume |
| 34.360 | 35.220 | 36.000 | 35.640 | 36.000 | Ouv. |
| 35.180 | 35.840 | 36.000 | 36.000 | 36.120 | + Haut |
| 34.360 | 35.120 | 35.360 | 35.640 | 35.620 | + Bas |
| 34.084 | 34.080 | 34.119 | 34.149 | 34.151 | MM20 |
| 34.619 | 34.646 | 34.686 | 34.718 | 34.740 | MM50 |
| 33.488 | 33.515 | 33.546 | 33.578 | 33.610 | MM100 |
Performances historiques RUBIS
| 5 jours | 1 mois | 1er janvier | 5 ans |
|---|---|---|---|
| +1.83 % | +2.47 % | +11.35 % | -11.19 % |
Court terme
Haussière
Moyen terme
Haussière
Long terme
Haussière
Portefeuille Trading
+332.70 % vs +66.15 % pour le CAC 40
Performance depuis le 28 mai 2008