


chiffres clés
Ouverture :
0.962 €
Perf Ouverture :
-9.98 %
+ Haut :
0.962 €
+ Bas :
0.866 €
Clôture veille :
0.980 €
Volume :
81 437
Capi échangé :
+0.66 %
Capi :
11 M€
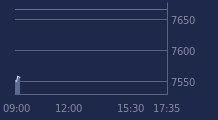
Graphique ROCTOOL sur 5 jours
Cours ROCTOOL sur 5 jours
| 17/03 | 18/03 | 19/03 | 20/03 | 23/03 | Date |
|---|---|---|---|---|---|
| 1.070(c) | 1.070(c) | 1.000(c) | 0.980(c) | 0.866 | Dernier |
| +4.90 % | 0.00 % | -6.54 % | -2.00 % | -11.63 % | Var. |
| 108 844 | 67 747 | 194 058 | 54 571 | 81 437 | Volume |
| 1.050 | 1.080 | 1.050 | 0.980 | 0.962 | Ouv. |
| 1.085 | 1.080 | 1.055 | 1.025 | 0.962 | + Haut |
| 0.970 | 1.030 | 0.964 | 0.964 | 0.866 | + Bas |
| 0.897 | 0.912 | 0.926 | 0.938 | 0.941 | MM20 |
| 0.718 | 0.728 | 0.738 | 0.747 | 0.753 | MM50 |
| 0.522 | 0.531 | 0.539 | 0.548 | 0.555 | MM100 |
Performances historiques ROCTOOL
| 5 jours | 1 mois | 1er janvier | 5 ans |
|---|---|---|---|
| -15.10 % | +16.40 % | +40.58 % | -64.21 % |
Court terme
Haussière
Moyen terme
Haussière
Long terme
Haussière
Pas de conseil sur cette valeur
Portefeuille Trading
+336.60 % vs +51.82 % pour le CAC 40
Performance depuis le 28 mai 2008