


chiffres clés
Ouverture :
10.380 €
Perf Ouverture :
-0.77 %
+ Haut :
10.520 €
+ Bas :
10.240 €
Clôture veille :
10.460 €
Volume :
53 611
Capi échangé :
+0.25 %
Capi :
219 M€
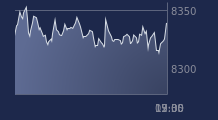
Graphique RIBER sur 5 jours
Cours RIBER sur 5 jours
| 06/07 | 07/07 | 08/07 | 09/07 | 10/07 | Date |
|---|---|---|---|---|---|
| 10.920(c) | 9.820(c) | 9.710(c) | 10.460(c) | 10.300(c) | Dernier |
| -3.19 % | -10.07 % | -1.12 % | +7.72 % | -1.53 % | Var. |
| 124 912 | 264 131 | 168 595 | 114 295 | 53 611 | Volume |
| 11.180 | 10.680 | 9.910 | 10.220 | 10.380 | Ouv. |
| 11.180 | 10.680 | 10.060 | 10.640 | 10.520 | + Haut |
| 10.740 | 9.630 | 9.520 | 10.220 | 10.240 | + Bas |
| 12.359 | 12.187 | 12.048 | 11.923 | 11.752 | MM20 |
| 13.256 | 13.184 | 13.136 | 13.111 | 13.062 | MM50 |
| 10.295 | 10.344 | 10.391 | 10.443 | 10.493 | MM100 |
Performances historiques RIBER
| 5 jours | 1 mois | 1er janvier | 5 ans |
|---|---|---|---|
| -8.69 % | -22.32 % | +194.29 % | +624.33 % |
Court terme
Baissière
Moyen terme
Baissière
Long terme
Neutre
Pas de conseil sur cette valeur
Portefeuille Trading
+319.20 % vs +67.75 % pour le CAC 40
Performance depuis le 28 mai 2008