Ouverture :
15.460 €
Perf Ouverture :
+1.03 %
+ Haut :
15.740 €
+ Bas :
15.460 €
Clôture veille :
15.420 €
Volume :
23 688
Capi échangé :
+0.07 %
Capi :
538 M€
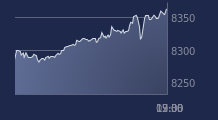
Graphique QUADIENT sur 5 jours
Cours QUADIENT sur 5 jours
| 06/01 | 07/01 | 08/01 | 09/01 | 09/01 | Date |
|---|---|---|---|---|---|
| 15.14 | 15.3 | 15.42 | 15.62 | 15.62 | Dernier |
| +2.02 % | +1.06 % | +0.78 % | +1.30 % | +1.30 % | Var. |
| 40537 | 45831 | 47427 | 23688 | 23688 | Volume |
| 14.78 | 15.22 | 15.5 | 15.46 | 15.46 | Ouv. |
| 15.14 | 15.32 | 15.8 | 15.74 | 15.74 | + Haut |
| 14.48 | 15.02 | 15.26 | 15.46 | 15.46 | + Bas |
| 14.525 | 14.545 | 14.597 | 14.648 | 14.648 | MM20 |
| 14.492 | 14.5092 | 14.5316 | 14.5528 | 14.5528 | MM50 |
| 14.7438 | 14.7354 | 14.7292 | 14.7228 | 14.7228 | MM100 |
Performances historiques QUADIENT
| 5 jours | 1 mois | 1er janvier | 5 ans |
|---|---|---|---|
| +7.72 % | +8.62 % | +7.87 % | -9.03 % |
Court terme
Haussière
Moyen terme
Haussière
Long terme
Neutre
Portefeuille Trading
+335.10 % vs +68.21 % pour le CAC 40
Performance depuis le 28 mai 2008


