


Ouverture :
-
Perf Ouverture :
-
+ Haut :
-
+ Bas :
-
Clôture veille :
8.900 €
Volume :
-
Capi échangé :
-
Capi :
76 M€
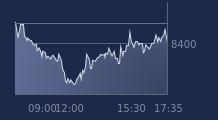
Graphique OMER-DECUGIS & CIE sur 5 jours
Cours OMER-DECUGIS & CIE sur 5 jours
| 17/06 | 18/06 | 19/06 | 22/06 | 23/06 | Date |
|---|---|---|---|---|---|
| 8.300(c) | 8.500(c) | 8.900(c) | 8.820(c) | - | Dernier |
| +1.47 % | +2.41 % | +4.71 % | -0.90 % | - | Var. |
| 841 | 5 449 | 4 986 | 9 411 | - | Volume |
| 8.220 | 8.300 | 8.500 | 8.900 | - | Ouv. |
| 8.340 | 8.500 | 8.900 | 8.940 | - | + Haut |
| 8.180 | 8.280 | 8.500 | 8.780 | - | + Bas |
| 8.238 | 8.241 | 8.268 | 8.285 | - | MM20 |
| 8.621 | 8.611 | 8.610 | 8.608 | - | MM50 |
| 8.958 | 8.945 | 8.946 | 8.952 | - | MM100 |
Performances historiques OMER-DECUGIS & CIE
| 5 jours | 1 mois | 1er janvier | 5 ans |
|---|---|---|---|
| +5.76 % | +4.50 % | +12.79 % | +17.76 % |
Court terme
Haussière
Moyen terme
Neutre
Long terme
Neutre
Pas de conseil sur cette valeur
Portefeuille Trading
+322.30 % vs +68.98 % pour le CAC 40
Performance depuis le 28 mai 2008