


chiffres clés
Ouverture :
0.230 €
Perf Ouverture :
+8.70 %
+ Haut :
0.250 €
+ Bas :
0.220 €
Clôture veille :
0.225 €
Volume :
50 764
Capi échangé :
+0.18 %
Capi :
7 M€
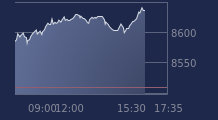
Graphique OKWIND sur 5 jours
Cours OKWIND sur 5 jours
| 28/07 | 29/07 | 30/07 | 31/07 | 03/08 | Date |
|---|---|---|---|---|---|
| 0.330(c) | 0.280(c) | 0.244(c) | 0.225(c) | 0.250 | Dernier |
| -2.37 % | -15.15 % | -12.86 % | -7.79 % | +11.11 % | Var. |
| 89 775 | 33 793 | 118 788 | 51 109 | 50 764 | Volume |
| 0.350 | 0.307 | 0.232 | 0.249 | 0.230 | Ouv. |
| 0.380 | 0.307 | 0.250 | 0.250 | 0.250 | + Haut |
| 0.330 | 0.280 | 0.220 | 0.225 | 0.220 | + Bas |
| 0.249 | 0.251 | 0.251 | 0.250 | 0.250 | MM20 |
| 0.267 | 0.266 | 0.264 | 0.263 | 0.261 | MM50 |
| 0.334 | 0.334 | 0.333 | 0.333 | 0.332 | MM100 |
Performances historiques OKWIND
| 5 jours | 1 mois | 1er janvier | 5 ans |
|---|---|---|---|
| -26.04 % | +3.83 % | -24.94 % | 0.00 % |
Court terme
Baissière
Moyen terme
Baissière
Long terme
Baissière
Pas de conseil sur cette valeur
Portefeuille Trading
+321.90 % vs +73.69 % pour le CAC 40
Performance depuis le 28 mai 2008