


chiffres clés
Ouverture :
47.200 €
Perf Ouverture :
+0.64 %
+ Haut :
47.500 €
+ Bas :
47.200 €
Clôture veille :
47.200 €
Volume :
62
Capi échangé :
+0.00 %
Capi :
160 M€
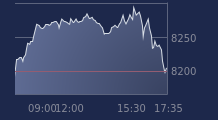
Graphique NSE sur 5 jours
Cours NSE sur 5 jours
| 03/06 | 04/06 | 05/06 | 08/06 | 09/06 | Date |
|---|---|---|---|---|---|
| 50.000(c) | 50.800(c) | 49.600(c) | 47.200(c) | 47.500(c) | Dernier |
| +0.40 % | +1.60 % | -2.36 % | -4.84 % | +0.64 % | Var. |
| 452 | 269 | 285 | 526 | 62 | Volume |
| 49.800 | 50.000 | 50.600 | 49.200 | 47.200 | Ouv. |
| 50.000 | 50.800 | 50.600 | 49.200 | 47.500 | + Haut |
| 48.000 | 49.800 | 49.600 | 47.100 | 47.200 | + Bas |
| 48.430 | 48.510 | 48.530 | 48.490 | 48.460 | MM20 |
| 50.122 | 50.174 | 50.202 | 50.170 | 50.150 | MM50 |
| 47.828 | 47.846 | 47.856 | 47.872 | 47.872 | MM100 |
Performances historiques NSE
| 5 jours | 1 mois | 1er janvier | 5 ans |
|---|---|---|---|
| -4.62 % | -3.46 % | +23.38 % | +179.41 % |
Court terme
Baissière
Moyen terme
Baissière
Long terme
Neutre
Pas de conseil sur cette valeur
Portefeuille Trading
+324.00 % vs +65.02 % pour le CAC 40
Performance depuis le 28 mai 2008