


chiffres clés
Ouverture :
47.300 €
Perf Ouverture :
-2.37 %
+ Haut :
47.300 €
+ Bas :
46.100 €
Clôture veille :
46.580 €
Volume :
930
Capi échangé :
+0.01 %
Capi :
594 M€
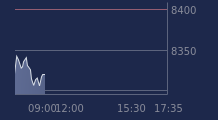
Graphique NORTH ATLANTIC ENERGIES sur 5 jours
Cours NORTH ATLANTIC ENERGIES sur 5 jours
| 17/06 | 18/06 | 19/06 | 22/06 | 23/06 | Date |
|---|---|---|---|---|---|
| 47.780(c) | 46.320(c) | 45.220(c) | 46.580(c) | 46.180 | Dernier |
| +0.13 % | -3.06 % | -2.37 % | +3.01 % | -0.86 % | Var. |
| 2 498 | 5 238 | 8 419 | 4 210 | 930 | Volume |
| 47.500 | 47.780 | 47.340 | 46.500 | 47.300 | Ouv. |
| 47.780 | 47.780 | 47.980 | 47.640 | 47.300 | + Haut |
| 46.720 | 45.940 | 45.220 | 46.080 | 46.100 | + Bas |
| 52.050 | 51.671 | 51.277 | 50.878 | 50.532 | MM20 |
| 55.353 | 55.104 | 54.807 | 54.584 | 54.307 | MM50 |
| 53.263 | 53.258 | 53.244 | 53.244 | 53.239 | MM100 |
Performances historiques NORTH ATLANTIC ENERGIES
| 5 jours | 1 mois | 1er janvier | 5 ans |
|---|---|---|---|
| -3.23 % | -13.03 % | +6.21 % | +306.87 % |
Court terme
Baissière
Moyen terme
Baissière
Long terme
Baissière
Portefeuille Trading
+322.30 % vs +67.51 % pour le CAC 40
Performance depuis le 28 mai 2008