


chiffres clés
Ouverture :
8.650 €
Perf Ouverture :
-3.35 %
+ Haut :
8.650 €
+ Bas :
8.290 €
Clôture veille :
8.880 €
Volume :
313 699
Capi échangé :
+0.56 %
Capi :
469 M€
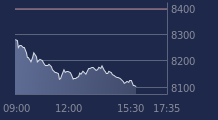
Graphique NEXITY sur 5 jours
Cours NEXITY sur 5 jours
| 25/02 | 26/02 | 27/02 | 02/03 | 03/03 | Date |
|---|---|---|---|---|---|
| 8.960(c) | 9.150(c) | 9.535(c) | 8.880(c) | 8.360 | Dernier |
| +0.06 % | +2.12 % | +4.21 % | -6.87 % | -5.86 % | Var. |
| 110 967 | 590 705 | 374 840 | 305 179 | 313 699 | Volume |
| 8.955 | 8.840 | 9.240 | 9.100 | 8.650 | Ouv. |
| 9.070 | 9.295 | 9.785 | 9.100 | 8.650 | + Haut |
| 8.790 | 8.300 | 9.240 | 8.650 | 8.290 | + Bas |
| 8.987 | 8.944 | 8.943 | 8.925 | 8.895 | MM20 |
| 8.899 | 8.905 | 8.917 | 8.917 | 8.906 | MM50 |
| 9.063 | 9.055 | 9.053 | 9.043 | 9.028 | MM100 |
Performances historiques NEXITY
| 5 jours | 1 mois | 1er janvier | 5 ans |
|---|---|---|---|
| -6.64 % | -9.47 % | -6.85 % | -79.25 % |
Court terme
Neutre
Moyen terme
Neutre
Long terme
Neutre
Portefeuille Trading
+333.50 % vs +63.05 % pour le CAC 40
Performance depuis le 28 mai 2008