


chiffres clés
Ouverture :
36.100 €
Perf Ouverture :
-0.28 %
+ Haut :
36.350 €
+ Bas :
35.800 €
Clôture veille :
36.000 €
Volume :
10 144
Capi échangé :
+0.04 %
Capi :
876 M€
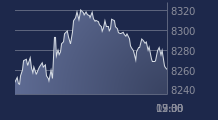
Graphique NEURONES sur 5 jours
Cours NEURONES sur 5 jours
| 02/04 | 07/04 | 08/04 | 09/04 | 10/04 | Date |
|---|---|---|---|---|---|
| 36.400(c) | 35.950(c) | 36.350(c) | 36.000(c) | 36.000(c) | Dernier |
| +1.39 % | -1.24 % | +1.11 % | -0.96 % | 0.00 % | Var. |
| 6 769 | 11 821 | 10 616 | 12 976 | 10 144 | Volume |
| 36.000 | 36.500 | 36.000 | 36.350 | 36.100 | Ouv. |
| 36.400 | 36.900 | 37.150 | 36.450 | 36.350 | + Haut |
| 35.600 | 35.950 | 36.000 | 35.800 | 35.800 | + Bas |
| 34.815 | 34.890 | 34.978 | 35.028 | 35.070 | MM20 |
| 36.124 | 36.042 | 35.977 | 35.905 | 35.837 | MM50 |
| 39.467 | 39.395 | 39.326 | 39.262 | 39.201 | MM100 |
Performances historiques NEURONES
| 5 jours | 1 mois | 1er janvier | 5 ans |
|---|---|---|---|
| -1.10 % | +4.05 % | -16.38 % | +28.57 % |
Court terme
Haussière
Moyen terme
Neutre
Long terme
Baissière
Portefeuille Trading
+332.70 % vs +66.15 % pour le CAC 40
Performance depuis le 28 mai 2008