


chiffres clés
Ouverture :
38.900 €
Perf Ouverture :
-2.78 %
+ Haut :
39.140 €
+ Bas :
37.300 €
Clôture veille :
38.960 €
Volume :
37 669
Capi échangé :
+0.15 %
Capi :
924 M€
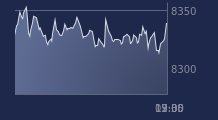
Graphique MERSEN sur 5 jours
Cours MERSEN sur 5 jours
| 06/07 | 07/07 | 08/07 | 09/07 | 10/07 | Date |
|---|---|---|---|---|---|
| 41.780(c) | 38.100(c) | 37.480(c) | 38.960(c) | 37.820(c) | Dernier |
| -1.00 % | -6.78 % | -1.63 % | +3.95 % | -2.93 % | Var. |
| 77 884 | 76 440 | 63 728 | 62 106 | 37 669 | Volume |
| 41.680 | 40.660 | 38.340 | 38.400 | 38.900 | Ouv. |
| 42.300 | 40.960 | 38.400 | 39.480 | 39.140 | + Haut |
| 40.600 | 38.100 | 37.060 | 38.180 | 37.300 | + Bas |
| 41.862 | 41.644 | 41.453 | 41.281 | 40.979 | MM20 |
| 39.150 | 39.343 | 39.524 | 39.683 | 39.801 | MM50 |
| 32.280 | 32.389 | 32.495 | 32.618 | 32.731 | MM100 |
Performances historiques MERSEN
| 5 jours | 1 mois | 1er janvier | 5 ans |
|---|---|---|---|
| -10.38 % | -10.93 % | +58.57 % | +12.39 % |
Court terme
Neutre
Moyen terme
Neutre
Long terme
Haussière
Portefeuille Trading
+319.20 % vs +67.75 % pour le CAC 40
Performance depuis le 28 mai 2008