


chiffres clés
Ouverture :
23.700 €
Perf Ouverture :
+1.69 %
+ Haut :
24.200 €
+ Bas :
23.650 €
Clôture veille :
23.800 €
Volume :
13 227
Capi échangé :
+0.03 %
Capi :
956 M€
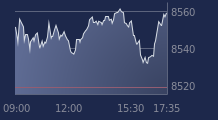
Graphique MANITOU BF sur 5 jours
Cours MANITOU BF sur 5 jours
| 20/02 | 23/02 | 24/02 | 25/02 | 26/02 | Date |
|---|---|---|---|---|---|
| 23.650(c) | 23.450(c) | 23.800(c) | 24.100(c) | - | Dernier |
| +4.19 % | -0.85 % | +1.49 % | +1.26 % | - | Var. |
| 40 391 | 15 228 | 28 202 | 13 227 | - | Volume |
| 22.600 | 23.350 | 23.450 | 23.700 | - | Ouv. |
| 23.650 | 23.700 | 24.150 | 24.200 | - | + Haut |
| 22.500 | 23.200 | 23.450 | 23.650 | - | + Bas |
| 21.854 | 22.143 | 22.443 | 22.748 | - | MM20 |
| 20.066 | 20.155 | 20.246 | 20.335 | - | MM50 |
| 19.016 | 19.067 | 19.119 | 19.173 | - | MM100 |
Performances historiques MANITOU BF
| 5 jours | 1 mois | 1er janvier | 5 ans |
|---|---|---|---|
| +5.24 % | +33.30 % | +24.87 % | -11.56 % |
Court terme
Haussière
Moyen terme
Haussière
Long terme
Haussière
Portefeuille Trading
+335.70 % vs +72.18 % pour le CAC 40
Performance depuis le 28 mai 2008