


chiffres clés
Ouverture :
2.620 €
Perf Ouverture :
+5.53 %
+ Haut :
2.820 €
+ Bas :
2.620 €
Clôture veille :
2.620 €
Volume :
14 384
Capi échangé :
+0.08 %
Capi :
52 M€
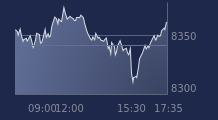
Graphique MAAT PHARMA sur 5 jours
Cours MAAT PHARMA sur 5 jours
| 15/07 | 16/07 | 17/07 | 20/07 | 21/07 | Date |
|---|---|---|---|---|---|
| 2.760(c) | 2.755(c) | 2.680(c) | 2.620(c) | 2.765(c) | Dernier |
| -2.82 % | -0.18 % | -2.72 % | -2.24 % | +5.53 % | Var. |
| 23 236 | 38 558 | 23 682 | 13 080 | 14 384 | Volume |
| 2.835 | 2.780 | 2.720 | 2.660 | 2.620 | Ouv. |
| 2.835 | 2.860 | 2.760 | 2.740 | 2.820 | + Haut |
| 2.660 | 2.740 | 2.650 | 2.620 | 2.620 | + Bas |
| 2.687 | 2.682 | 2.673 | 2.665 | 2.666 | MM20 |
| 3.630 | 3.550 | 3.472 | 3.380 | 3.290 | MM50 |
| 4.985 | 4.941 | 4.895 | 4.847 | 4.802 | MM100 |
Performances historiques MAAT PHARMA
| 5 jours | 1 mois | 1er janvier | 5 ans |
|---|---|---|---|
| -2.64 % | -3.15 % | -42.52 % | 0.00 % |
Court terme
Haussière
Moyen terme
Neutre
Long terme
Baissière
Pas de conseil sur cette valeur
Portefeuille Trading
+318.60 % vs +68.23 % pour le CAC 40
Performance depuis le 28 mai 2008