


chiffres clés
Ouverture :
19.1520 €
+ Haut :
19.2420 €
+ Bas :
19.1140 €
Perf Ouverture :
+0.39 %
Clôture veille :
18.7820 €
Volume :
13 185
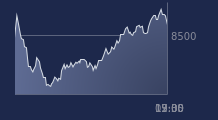
Graphique LYXOR ETF MSCI EM sur 5 jours
Cours LYXOR ETF MSCI EM sur 5 jours
| 29/06 | 30/06 | 01/07 | 02/07 | 03/07 | Date |
|---|---|---|---|---|---|
| 18.9860(c) | 19.4380(c) | 19.2160(c) | 18.7820(c) | 19.2260(c) | Dernier |
| -1.07 % | +2.38 % | -1.14 % | -2.26 % | +2.36 % | Var. |
| 19.1340 | 19.2620 | 19.1820 | 18.7800 | 19.1520 | Ouv. |
| 19.2060 | 19.4620 | 19.2500 | 19.0920 | 19.2420 | + Haut |
| 18.9280 | 19.2380 | 19.0760 | 18.6980 | 19.1140 | + Bas |
| 19.2164 | 19.2016 | 19.1864 | 19.1651 | 19.2008 | MM20 |
| 18.6129 | 18.6545 | 18.6933 | 18.7192 | 18.7550 | MM50 |
| 17.5451 | 17.5777 | 17.6058 | 17.6286 | 17.6554 | MM100 |
Produit
Trackers
Type de produit
Pays émergents
Sous-jacent
MSCI EMERGING MA…
Type de sous-jacent
-
Emetteur
LYXOR ASSET MANAGEMENT
Portefeuille Trading
+320.20 % vs +71.15 % pour le CAC 40
Performance depuis le 28 mai 2008