


chiffres clés
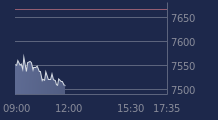
Ouverture :
15.3980 €
+ Haut :
15.4440 €
+ Bas :
15.3430 €
Perf Ouverture :
-0.19 %
Clôture veille :
15.7000 €
Volume :
36 195
Graphique LYXOR ETF MSCI EM sur 5 jours
Cours LYXOR ETF MSCI EM sur 5 jours
| 17/03 | 18/03 | 19/03 | 20/03 | 23/03 | Date |
|---|---|---|---|---|---|
| 16.5180(c) | 16.3760(c) | 16.0470(c) | 15.7000(c) | 15.3690 | Dernier |
| +0.75 % | -0.86 % | -2.01 % | -2.16 % | -2.11 % | Var. |
| 16.4490 | 16.7410 | 16.2160 | 16.1070 | 15.3980 | Ouv. |
| 16.5860 | 16.7410 | 16.2480 | 16.1340 | 15.4440 | + Haut |
| 16.3990 | 16.3760 | 15.8940 | 15.7000 | 15.3430 | + Bas |
| 16.6500 | 16.6232 | 16.5836 | 16.5139 | 16.4322 | MM20 |
| 16.4130 | 16.4247 | 16.4307 | 16.4277 | 16.4153 | MM50 |
| 15.7276 | 15.7397 | 15.7473 | 15.7518 | 15.7514 | MM100 |
Produit
Trackers
Type de produit
Pays émergents
Sous-jacent
MSCI EMERGING MA…
Type de sous-jacent
-
Emetteur
LYXOR ASSET MANAGEMENT
Portefeuille Trading
+336.60 % vs +51.24 % pour le CAC 40
Performance depuis le 28 mai 2008