


chiffres clés
Ouverture :
250.0500 €
+ Haut :
252.0000 €
+ Bas :
250.0000 €
Perf Ouverture :
+0.62 %
Clôture veille :
249.3500 €
Volume :
6 114
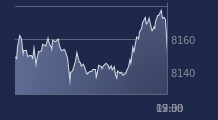
Graphique LYXOR ETF LEVDAX sur 5 jours
Cours LYXOR ETF LEVDAX sur 5 jours
| 15/12 | 16/12 | 17/12 | 18/12 | 19/12 | Date |
|---|---|---|---|---|---|
| 251.5000(c) | 248.3000(c) | 245.6500(c) | 249.3500(c) | 251.6000(c) | Dernier |
| +0.50 % | -1.27 % | -1.07 % | +1.51 % | +0.90 % | Var. |
| 252.3000 | 248.6500 | 249.3000 | 244.7000 | 250.0500 | Ouv. |
| 252.8000 | 250.0000 | 249.4500 | 249.4000 | 252.0000 | + Haut |
| 251.4500 | 247.0500 | 245.5500 | 244.5000 | 250.0000 | + Bas |
| 241.5720 | 242.4520 | 243.1820 | 243.9920 | 245.1300 | MM20 |
| 247.1440 | 246.9790 | 246.6620 | 246.4200 | 246.3830 | MM50 |
| 247.7840 | 247.7060 | 247.5980 | 247.5660 | 247.6900 | MM100 |
Produit
Trackers
Type de produit
Leveraged
Sous-jacent
LEVDAX
Type de sous-jacent
-
Emetteur
LYXOR ASSET MANAGEMENT
Portefeuille Trading
+335.20 % vs +63.98 % pour le CAC 40
Performance depuis le 28 mai 2008