


chiffres clés
Ouverture :
24.5350 €
+ Haut :
24.9100 €
+ Bas :
24.4450 €
Perf Ouverture :
+1.53 %
Clôture veille :
24.4500 €
Volume :
43 810
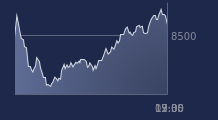
Graphique LYXOR ETF IBOVESPA sur 5 jours
Cours LYXOR ETF IBOVESPA sur 5 jours
| 29/06 | 30/06 | 01/07 | 02/07 | 03/07 | Date |
|---|---|---|---|---|---|
| 24.5000(c) | 24.2300(c) | 24.3450(c) | 24.4500(c) | 24.9100(c) | Dernier |
| -0.85 % | -1.10 % | +0.47 % | +0.43 % | +1.88 % | Var. |
| 24.7850 | 24.6400 | 24.5450 | 24.4050 | 24.5350 | Ouv. |
| 24.8550 | 24.6600 | 24.5450 | 24.7100 | 24.9100 | + Haut |
| 24.4500 | 24.1950 | 24.1500 | 24.3050 | 24.4450 | + Bas |
| 24.1203 | 24.0963 | 24.1089 | 24.1270 | 24.1803 | MM20 |
| 25.4089 | 25.3302 | 25.2528 | 25.1812 | 25.1205 | MM50 |
| 25.8114 | 25.8008 | 25.7900 | 25.7776 | 25.7676 | MM100 |
Produit
Trackers
Type de produit
Brésil
Sous-jacent
IBOVESPA
Type de sous-jacent
-
Emetteur
LYXOR A.M.
Portefeuille Trading
+320.20 % vs +71.15 % pour le CAC 40
Performance depuis le 28 mai 2008