


chiffres clés
Ouverture :
-
+ Haut :
-
+ Bas :
-
Perf Ouverture :
-
Clôture veille :
46.4290 €
Volume :
-
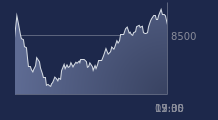
Graphique LYXOR ETF FEN US sur 5 jours
Cours LYXOR ETF FEN US sur 5 jours
| 29/06 | 30/06 | 01/07 | 02/07 | 03/07 | Date |
|---|---|---|---|---|---|
| - | - | - | - | - | Dernier |
| - | - | - | - | - | Var. |
| - | - | - | - | - | Ouv. |
| - | - | - | - | - | + Haut |
| - | - | - | - | - | + Bas |
| - | - | - | - | - | MM20 |
| - | - | - | - | - | MM50 |
| - | - | - | - | - | MM100 |
Produit
Trackers
Type de produit
Immobilier US
Sous-jacent
MSCI USA REAL ES…
Type de sous-jacent
-
Emetteur
LYXOR INTERNATIONAL ASSET MANAGEMENT
Portefeuille Trading
+320.20 % vs +71.15 % pour le CAC 40
Performance depuis le 28 mai 2008