


chiffres clés
Ouverture :
468.9000 €
+ Haut :
468.9000 €
+ Bas :
467.1000 €
Perf Ouverture :
-0.18 %
Clôture veille :
466.7000 €
Volume :
316
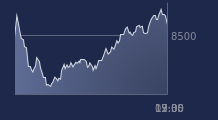
Graphique LYXOR ETF DJIA sur 5 jours
Cours LYXOR ETF DJIA sur 5 jours
| 29/06 | 30/06 | 01/07 | 02/07 | 03/07 | Date |
|---|---|---|---|---|---|
| 462.1000(c) | 464.0000(c) | 467.6500(c) | 466.7000(c) | 468.0500(c) | Dernier |
| -0.12 % | +0.41 % | +0.79 % | -0.20 % | +0.29 % | Var. |
| 461.0000 | 464.3500 | 463.4000 | 464.7500 | 468.9000 | Ouv. |
| 463.6500 | 465.2500 | 467.6500 | 466.7000 | 468.9000 | + Haut |
| 461.0000 | 463.5500 | 462.9000 | 464.7500 | 467.1000 | + Bas |
| 453.2070 | 454.1170 | 455.2920 | 456.1550 | 457.0250 | MM20 |
| 439.7710 | 440.5830 | 441.4380 | 442.2290 | 443.0460 | MM50 |
| 427.3240 | 427.7730 | 428.2010 | 428.6240 | 429.0390 | MM100 |
Produit
Trackers
Type de produit
Dow Jones
Sous-jacent
Type de sous-jacent
-
Emetteur
LYXOR A.M.
Portefeuille Trading
+320.20 % vs +71.15 % pour le CAC 40
Performance depuis le 28 mai 2008