


chiffres clés
Ouverture :
44.1930 €
+ Haut :
44.3790 €
+ Bas :
44.1840 €
Perf Ouverture :
+0.42 %
Clôture veille :
44.1010 €
Volume :
80
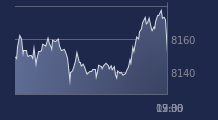
Graphique LYXOR ETF BUND DDS sur 5 jours
Cours LYXOR ETF BUND DDS sur 5 jours
| 15/12 | 16/12 | 17/12 | 18/12 | 19/12 | Date |
|---|---|---|---|---|---|
| 44.0280(c) | 44.1000(c) | 44.1180(c) | 44.1010(c) | 44.3790(c) | Dernier |
| -0.30 % | +0.16 % | +0.04 % | -0.04 % | +0.63 % | Var. |
| 44.0310 | 44.0470 | 43.9770 | 44.0420 | 44.1930 | Ouv. |
| 44.0710 | 44.1000 | 44.1180 | 44.3230 | 44.3790 | + Haut |
| 43.9960 | 44.0470 | 43.9770 | 43.9980 | 44.1840 | + Bas |
| 43.3902 | 43.4468 | 43.4984 | 43.5471 | 43.6220 | MM20 |
| 42.8816 | 42.9020 | 42.9268 | 42.9517 | 42.9883 | MM50 |
| 42.9498 | 42.9612 | 42.9728 | 42.9847 | 42.9994 | MM100 |
Produit
Trackers
Type de produit
Short
Sous-jacent
SGI DAILY DOUBLE…
Type de sous-jacent
-
Emetteur
LYXOR INTERNATIONAL ASSET MANAGEMENT
Portefeuille Trading
+335.20 % vs +63.98 % pour le CAC 40
Performance depuis le 28 mai 2008