


chiffres clés
Ouverture :
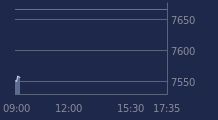
19.600 €
Perf Ouverture :
-0.92 %
+ Haut :
19.600 €
+ Bas :
19.260 €
Clôture veille :
19.720 €
Volume :
3 316
Capi échangé :
+0.02 %
Capi :
418 M€
Graphique JACQUET METALS sur 5 jours
Cours JACQUET METALS sur 5 jours
| 17/03 | 18/03 | 19/03 | 20/03 | 23/03 | Date |
|---|---|---|---|---|---|
| 21.500(c) | 21.600(c) | 20.000(c) | 19.720(c) | 19.420 | Dernier |
| -0.92 % | +0.47 % | -7.41 % | -1.40 % | -1.52 % | Var. |
| 3 623 | 6 136 | 9 562 | 10 707 | 3 316 | Volume |
| 21.700 | 21.500 | 21.600 | 20.000 | 19.600 | Ouv. |
| 21.800 | 21.900 | 21.600 | 20.550 | 19.600 | + Haut |
| 21.500 | 21.500 | 19.940 | 19.700 | 19.260 | + Bas |
| 22.725 | 22.590 | 22.378 | 22.199 | 22.010 | MM20 |
| 22.793 | 22.793 | 22.771 | 22.748 | 22.727 | MM50 |
| 20.549 | 20.584 | 20.603 | 20.619 | 20.637 | MM100 |
Performances historiques JACQUET METALS
| 5 jours | 1 mois | 1er janvier | 5 ans |
|---|---|---|---|
| -10.51 % | -16.65 % | -2.41 % | +2.10 % |
Court terme
Baissière
Moyen terme
Baissière
Long terme
Neutre
Portefeuille Trading
+336.60 % vs +51.94 % pour le CAC 40
Performance depuis le 28 mai 2008