


chiffres clés
Ouverture :
19.800 €
Perf Ouverture :
-0.76 %
+ Haut :
19.850 €
+ Bas :
19.650 €
Clôture veille :
19.830 €
Volume :
626 077
Capi échangé :
+0.11 %
Capi :
10 808 M€
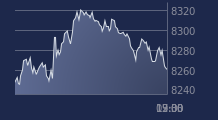
Graphique GETLINK SE sur 5 jours
Cours GETLINK SE sur 5 jours
| 02/04 | 07/04 | 08/04 | 09/04 | 10/04 | Date |
|---|---|---|---|---|---|
| 19.370(c) | 19.390(c) | 19.520(c) | 19.830(c) | 19.650(c) | Dernier |
| +1.68 % | +0.10 % | +0.67 % | +1.59 % | -0.91 % | Var. |
| 666 043 | 1 352 910 | 1 097 160 | 951 088 | 626 077 | Volume |
| 18.850 | 19.460 | 19.700 | 19.570 | 19.800 | Ouv. |
| 19.370 | 19.630 | 19.790 | 19.830 | 19.850 | + Haut |
| 18.800 | 19.380 | 19.200 | 19.500 | 19.650 | + Bas |
| 17.853 | 17.942 | 18.042 | 18.165 | 18.267 | MM20 |
| 17.609 | 17.676 | 17.744 | 17.811 | 17.873 | MM50 |
| 16.644 | 16.679 | 16.717 | 16.757 | 16.796 | MM100 |
Performances historiques GETLINK SE
| 5 jours | 1 mois | 1er janvier | 5 ans |
|---|---|---|---|
| +1.45 % | +12.09 % | +24.92 % | +50.69 % |
Court terme
Haussière
Moyen terme
Haussière
Long terme
Haussière
Portefeuille Trading
+332.70 % vs +66.15 % pour le CAC 40
Performance depuis le 28 mai 2008