Ouverture :
81.850 €
Perf Ouverture :
-0.73 %
+ Haut :
81.900 €
+ Bas :
80.600 €
Clôture veille :
81.850 €
Volume :
114 279
Capi échangé :
+0.15 %
Capi :
6 239 M€
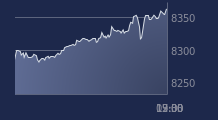
Graphique GECINA sur 5 jours
Cours GECINA sur 5 jours
| 06/01 | 07/01 | 08/01 | 09/01 | 09/01 | Date |
|---|---|---|---|---|---|
| 79.45 | 82.8 | 81.85 | 81.25 | 81.25 | Dernier |
| -0.63 % | +4.22 % | -1.15 % | -0.73 % | -0.73 % | Var. |
| 112571 | 198801 | 133331 | 114279 | 114279 | Volume |
| 80 | 80.4 | 82.8 | 81.85 | 81.85 | Ouv. |
| 80.2 | 83.15 | 82.85 | 81.9 | 81.9 | + Haut |
| 78.85 | 80 | 81.25 | 80.6 | 80.6 | + Bas |
| 79.755 | 79.92 | 80.055 | 80.1575 | 80.1575 | MM20 |
| 79.956 | 79.96 | 79.943 | 79.938 | 79.938 | MM50 |
| 81.9665 | 81.924 | 81.8775 | 81.824 | 81.824 | MM100 |
Performances historiques GECINA
| 5 jours | 1 mois | 1er janvier | 5 ans |
|---|---|---|---|
| +1.31 % | +2.65 % | +0.43 % | -34.69 % |
Court terme
Haussière
Moyen terme
Neutre
Long terme
Baissière
Portefeuille Trading
+335.10 % vs +68.21 % pour le CAC 40
Performance depuis le 28 mai 2008


