chiffres clés
Ouverture :
1 320.000 €
Perf Ouverture :
-0.15 %
+ Haut :
1 320.000 €
+ Bas :
1 308.000 €
Clôture veille :
1 316.000 €
Volume :
584
Capi échangé :
+0.01 %
Capi :
8 656 M€
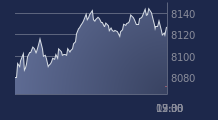
Graphique FINANCIERE ODET sur 5 jours
Cours FINANCIERE ODET sur 5 jours
| 26/01 | 27/01 | 28/01 | 29/01 | 30/01 | Date |
|---|---|---|---|---|---|
| 1318.000(c) | 1316.000(c) | 1318.000(c) | 1316.000(c) | 1318.000(c) | Dernier |
| -0.75 % | -0.15 % | +0.15 % | -0.15 % | +0.15 % | Var. |
| 275 | 258 | 180 | 477 | 584 | Volume |
| 1320.000 | 1318.000 | 1316.000 | 1318.000 | 1320.000 | Ouv. |
| 1322.000 | 1318.000 | 1320.000 | 1320.000 | 1320.000 | + Haut |
| 1312.000 | 1306.000 | 1308.000 | 1308.000 | 1308.000 | + Bas |
| 1335.400 | 1334.700 | 1333.400 | 1332.100 | 1330.500 | MM20 |
| 1335.000 | 1334.880 | 1334.880 | 1334.720 | 1334.920 | MM50 |
| 1345.180 | 1344.160 | 1343.160 | 1342.060 | 1340.740 | MM100 |
Performances historiques FINANCIERE ODET
| 5 jours | 1 mois | 1er janvier | 5 ans |
|---|---|---|---|
| -0.75 % | -0.90 % | -1.79 % | +67.68 % |
Court terme
Baissière
Moyen terme
Neutre
Long terme
Neutre
Portefeuille Trading
+338.60 % vs +63.48 % pour le CAC 40
Performance depuis le 28 mai 2008


