


chiffres clés
Ouverture :
57.600 €
Perf Ouverture :
+2.26 %
+ Haut :
60.200 €
+ Bas :
56.800 €
Clôture veille :
55.600 €
Volume :
96 034
Capi échangé :
+0.19 %
Capi :
3 000 M€
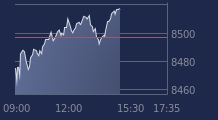
Graphique EXOSENS sur 5 jours
Cours EXOSENS sur 5 jours
| 18/02 | 19/02 | 20/02 | 23/02 | 24/02 | Date |
|---|---|---|---|---|---|
| 59.900(c) | 60.500(c) | 61.500(c) | 55.600(c) | 58.900 | Dernier |
| +1.01 % | +1.00 % | +1.65 % | -9.59 % | +5.94 % | Var. |
| 74 797 | 70 712 | 137 956 | 161 288 | 96 034 | Volume |
| 59.300 | 59.800 | 60.200 | 61.700 | 57.600 | Ouv. |
| 60.400 | 60.500 | 61.500 | 62.000 | 60.200 | + Haut |
| 58.800 | 58.700 | 59.900 | 55.600 | 56.800 | + Bas |
| 54.660 | 54.955 | 55.290 | 55.400 | 55.655 | MM20 |
| 52.483 | 52.728 | 52.980 | 53.126 | 53.358 | MM50 |
| 48.942 | 49.107 | 49.290 | 49.406 | 49.545 | MM100 |
Performances historiques EXOSENS
| 5 jours | 1 mois | 1er janvier | 5 ans |
|---|---|---|---|
| -0.67 % | +7.48 % | +21.57 % | 0.00 % |
Court terme
Haussière
Moyen terme
Haussière
Long terme
Haussière
Portefeuille Trading
+335.50 % vs +71.42 % pour le CAC 40
Performance depuis le 28 mai 2008