


chiffres clés
Ouverture :
26.240 €
Perf Ouverture :
-0.69 %
+ Haut :
26.380 €
+ Bas :
26.060 €
Clôture veille :
26.160 €
Volume :
479 228
Capi échangé :
+0.21 %
Capi :
6 068 M€
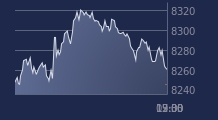
Graphique ELIS sur 5 jours
Cours ELIS sur 5 jours
| 02/04 | 07/04 | 08/04 | 09/04 | 10/04 | Date |
|---|---|---|---|---|---|
| 25.080(c) | 24.960(c) | 26.040(c) | 26.160(c) | 26.060(c) | Dernier |
| +0.16 % | -0.48 % | +4.33 % | +0.46 % | -0.38 % | Var. |
| 382 971 | 360 769 | 595 159 | 292 043 | 479 228 | Volume |
| 24.640 | 25.080 | 26.040 | 25.980 | 26.240 | Ouv. |
| 25.220 | 25.380 | 26.220 | 26.300 | 26.380 | + Haut |
| 24.640 | 24.780 | 25.800 | 25.980 | 26.060 | + Bas |
| 24.850 | 24.865 | 24.947 | 25.002 | 25.012 | MM20 |
| 25.604 | 25.622 | 25.656 | 25.689 | 25.721 | MM50 |
| 24.867 | 24.873 | 24.887 | 24.900 | 24.913 | MM100 |
Performances historiques ELIS
| 5 jours | 1 mois | 1er janvier | 5 ans |
|---|---|---|---|
| +3.91 % | +6.80 % | +7.42 % | +75.72 % |
Court terme
Haussière
Moyen terme
Haussière
Long terme
Haussière
Portefeuille Trading
+332.70 % vs +66.15 % pour le CAC 40
Performance depuis le 28 mai 2008