


chiffres clés
Ouverture :
28.900 €
Perf Ouverture :
-0.69 %
+ Haut :
29.300 €
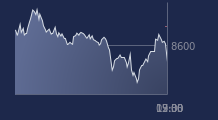
+ Bas :
28.600 €
Clôture veille :
28.800 €
Volume :
4 383
Capi échangé :
+0.17 %
Capi :
75 M€
Graphique DELFINGEN sur 5 jours
Cours DELFINGEN sur 5 jours
| 23/02 | 24/02 | 25/02 | 26/02 | 27/02 | Date |
|---|---|---|---|---|---|
| 31.000(c) | 31.000(c) | 29.600(c) | 28.800(c) | 28.700(c) | Dernier |
| 0.00 % | 0.00 % | -4.52 % | -2.70 % | -0.35 % | Var. |
| 155 | 1 972 | 3 153 | 3 143 | 4 383 | Volume |
| 31.200 | 31.000 | 31.000 | 29.500 | 28.900 | Ouv. |
| 31.300 | 31.100 | 31.100 | 29.600 | 29.300 | + Haut |
| 31.000 | 30.900 | 29.500 | 28.600 | 28.600 | + Bas |
| 33.565 | 33.395 | 33.125 | 32.815 | 32.525 | MM20 |
| 34.408 | 34.278 | 34.128 | 33.952 | 33.782 | MM50 |
| 34.099 | 34.065 | 34.009 | 33.952 | 33.889 | MM100 |
Performances historiques DELFINGEN
| 5 jours | 1 mois | 1er janvier | 5 ans |
|---|---|---|---|
| -7.42 % | -16.57 % | -15.34 % | -31.67 % |
Court terme
Baissière
Moyen terme
Baissière
Long terme
Baissière
Pas de conseil sur cette valeur
Portefeuille Trading
+334.30 % vs +72.61 % pour le CAC 40
Performance depuis le 28 mai 2008