


chiffres clés
Ouverture :
1.155 €
Perf Ouverture :
-2.16 %
+ Haut :
1.155 €
+ Bas :
1.120 €
Clôture veille :
1.145 €
Volume :
15 479
Capi échangé :
+0.01 %
Capi :
135 M€
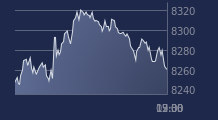
Graphique DEEZER sur 5 jours
Cours DEEZER sur 5 jours
| 07/04 | 08/04 | 09/04 | 10/04 | 13/04 | Date |
|---|---|---|---|---|---|
| 1.085(c) | 1.150(c) | 1.145(c) | 1.130(c) | - | Dernier |
| -1.36 % | +5.99 % | -0.43 % | -1.31 % | - | Var. |
| 28 848 | 52 254 | 6 458 | 15 479 | - | Volume |
| 1.100 | 1.080 | 1.150 | 1.155 | - | Ouv. |
| 1.115 | 1.150 | 1.160 | 1.155 | - | + Haut |
| 1.075 | 1.080 | 1.130 | 1.120 | - | + Bas |
| 1.146 | 1.148 | 1.150 | 1.151 | - | MM20 |
| 1.132 | 1.133 | 1.133 | 1.134 | - | MM50 |
| 1.096 | 1.097 | 1.098 | 1.100 | - | MM100 |
Performances historiques DEEZER
| 5 jours | 1 mois | 1er janvier | 5 ans |
|---|---|---|---|
| +2.73 % | +2.73 % | -0.88 % | 0.00 % |
Court terme
Neutre
Moyen terme
Haussière
Long terme
Haussière
Pas de conseil sur cette valeur
Portefeuille Trading
+332.70 % vs +66.15 % pour le CAC 40
Performance depuis le 28 mai 2008