


chiffres clés
Ouverture :
26.900 €
Perf Ouverture :
0.00 %
+ Haut :
26.900 €
+ Bas :
26.900 €
Clôture veille :
26.800 €
Volume :
11
Capi échangé :
+0.00 %
Capi :
414 M€
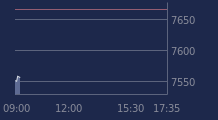
Graphique CRCAM BRIE PIC2CCI sur 5 jours
Cours CRCAM BRIE PIC2CCI sur 5 jours
| 17/03 | 18/03 | 19/03 | 20/03 | 23/03 | Date |
|---|---|---|---|---|---|
| 27.700(c) | 27.730(c) | 27.100(c) | 26.800(c) | 26.900 | Dernier |
| -1.77 % | +0.11 % | -2.27 % | -1.11 % | +0.37 % | Var. |
| 11 366 | 4 179 | 4 954 | 6 754 | 11 | Volume |
| 28.205 | 28.000 | 27.730 | 27.105 | 26.900 | Ouv. |
| 28.320 | 28.220 | 27.730 | 27.460 | 26.900 | + Haut |
| 27.700 | 27.700 | 27.035 | 26.610 | 26.900 | + Bas |
| 28.124 | 28.021 | 27.902 | 27.802 | 27.709 | MM20 |
| 29.039 | 29.020 | 28.994 | 28.951 | 28.899 | MM50 |
| 28.979 | 28.957 | 28.934 | 28.919 | 28.900 | MM100 |
Performances historiques CRCAM BRIE PIC2CCI
| 5 jours | 1 mois | 1er janvier | 5 ans |
|---|---|---|---|
| -4.61 % | -6.60 % | -8.46 % | +17.98 % |
Court terme
Baissière
Moyen terme
Baissière
Long terme
Baissière
Pas de news sur cette valeur
Portefeuille Trading
+336.60 % vs +51.76 % pour le CAC 40
Performance depuis le 28 mai 2008